
Skillbuilding: Mitigation of Incomplete Pedigrees to Identify the Source of Shared Autosomal DNA
Karen Stanbary, MA, LCSW, CG
“Mitigation of Incomplete Pedigrees to Identify the Source of Shared Autosomal DNA,” OnBoard, 29 (September 2023): 20–21.
A common mistake in DNA analysis occurs when we rule in conclusions in-stead of ruling out competing hypotheses. Many genealogists naively scan their match lists for ancestral surnames and too hastily conclude that their shared autosomal DNA (atDNA) came through that surname. We see what we want to see. Confirmation bias pollutes our conclusions.
Inconsistent with genealogy methodology principles, ruling in violates the best practice guidance described in Genealogy Standards:
- Standard 17(Extent)
- Standard 50 (Assembling conclusions from evidence)
- Standard 52 (Analyzing DNA test results)
- Standard 53 (Extent of DNA evidence)1
Pedigree evaluation to the generation of the research subject may reveal tree incompleteness. These gaps in compared pedigrees could contain an absent common ancestor for shared atDNA despite another common ancestor’s presence. Gaps represent competing hypotheses. Genealogists rule out competing hypotheses until a single answer to the research question remains. Mitigation means “to cause to become less harsh or hostile,”2 softening or reducing a problem’s impact. Genealogists may employ strategies to mitigate incomplete pedigrees. Evaluation without mitigation of the problem is meaningless.
We have at least fifteen ways to mitigate gaps in pedigrees:
Substitute a test taker with a more complete pedigree. This strategy may save time.
Conduct additional documentary research. Many online trees end when no direct evidence supports a parent-child relationship. Indirect evidence may support a proof argument that extends the pedigree.
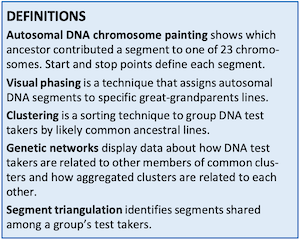
Employ advanced atDNA analysis techniques like clustering, genetic networks, chromosome painting, visual phasing, and segment triangulation.3 This analysis may lead to clues pointing to genetic kin and possible common ancestral lines to research in documentary sources. For example, visual phasing extends the field (chromosome area defined by recombination points) to capture autosomal matches. This provides an opportunity to find more cousins. Adding them to a study group and building their trees may suggest further documentary research to identify previously unknown possibilities for common ancestors or target searches in an unexplored location.
Use advanced analysis techniques to add a layer to the analysis that eliminates competing hypotheses. Selecting the closest matches in a genetic cluster and analyzing them to eliminate competing relationship hypotheses may lead to credible conclusions. Build selected matches’ trees to integrate their relationships into one family. Research that family to find other collateral relatives. Visual phasing to attribute chromosome segments to specific great-grandparents can eliminate seventy-five percent of a pedigree from consideration. Reason from the patterns re-vealed in visual phasing. For example, if someone shares DNA with only two or three siblings, and the paternal chromosome is phased to reveal that the three siblings share identical segments in that location, then the genealogist can conclude that the match is related to the siblings on the maternal side. Visual phasing will reveal the set of great-grandparents who contributed that DNA segment.
Articulate reasoning arguing that gaps in the pedigree are irrelevant to the research question. This strategy justifies decisions to discard pedigree branches from consideration. For example, the research subject was born in France in 1810 and immigrated in 1830. The match’s paternal ancestors were born in Mexico and immigrated in 1950. Therefore, gaps on the paternal lines are irrelevant to the question.
Harness the power of X-DNA’s in-heritance path to rule out ancestral lines as impossible. A father never passes X-DNA to his son. A female can never inherit X-DNA from her paternal grandfather. This justifies eliminating branches through earlier generations.
Correlate matches from both sides of the ancestral couple to justify the elimination of irrelevant ancestral lines even when those lines include unknown ancestors. This applies only when the couple shares no biological relationship.
Select and analyze DNA test takers related to multiple base test takers. Integrated documentary and genetic evidence provide bases for relationship conclusions. If DNA test takers related through multiple ancestral lines share DNA with an extensive comparative group of independent test takers on the same ancestral line, other common ancestors do not affect the conclusion. For example, a genealogist tested three siblings and three of their first cousins who descend from different children of their shared grandparents. If a match shares multiple segments with at least three of the six, concluding that the match is related somewhere on the original test takers’ common ancestral lines is reasonable. If the match is related in two ways, then the amount of shared DNA may increase, but that is irrelevant to the documented relationship in the first comparison.
Maximize the research subject’s genome coverage to capture DNA test takers descending from more distant ancestors. The test of one child of a deceased parent provides 50 percent coverage of that parent’s genome. The tests of three children of the same deceased parent provide about 87.5 per-cent coverage. The more coverage, the better chance of identifying DNA test takers who eliminate pedigree branches.
Analyze shared segments for a unique admixture This strategy is helpful when one or two compared pedigrees includes ancestorsof a distinct ethnicity. When a DNA test taker is 100 percent Pacific Islander and is compared to another whose mother is Hawaiian but whose father is from England, then the test takers are related on the second person’s maternal side, eliminating the paternal side from consideration.
Consider members of genetic clusters as the FAN club for DNA analysis. Genealogists are familiar with the power of the FAN club to create a compelling body of evidence. Consider genetic clusters as the research subject’s biological FAN club.4 Cluster networks might suggest merged ancestral lines, which when aggregated support a reasoned proof argument. A child was born in 1810 in Fulton County, Illinois.
Cluster analysis of descendants reveals two clusters from Fulton County. Analysis may point to one brother of several as the common ancestor. Cluster 1 represents him, and cluster 2 represents his wife.
Avoid using DNA test takers who share only small segments. Serendipitous match lists tempt genealogists to reason from them. The more distant the relationship, the more possibilities exist for common ancestors; thus more lines exist that need elimination. Standard 51 (Planning DNA tests) reminds us that an “effective plan for DNA testing is selective and targeted. . . . Genealogists . . . Select previous test takers and target new test takers based on their DNA’s potential to help answer a genealogical research question.”5 Genealogists do not select sources based on ease of access. They target test individuals who are closer to the research subject. A second cousin can be related through one of four great-grandparent couples. A fourth cousin can be related through one of sixteen couples. Would you rather rule out three couples or fifteen couples? Furthermore, a DNA test taker who shares multiple small segments may reflect descent from an endogamous community with a common ancestor outside a genealogical time frame and different than the hypothesized one. Two DNA test takers descending from an endogamous community may share 60 cM, but the data reveals seven segments ≤ 10 cM. These are likely old segments not reflecting a half third cousin relationship.
Correlate chromosome painting of multiple common segments to eliminate the competition. Employ inferential logic to reach intermediate conclusions that, when correlated, support a single answer.
Integrated genetic and documentary evidence may support only one answer to a research question.
Utilize the power of Big-Y testing to identify patrilineal kin who may not appear on Y-STR tests. Identifying two men who share the same patrilineal line may eliminate the rest of the pedigree from consideration.
The best tool to use when analyzing connections between documentary and genetic evidence is your brain. Play devil’s advocate with yourself. Try to disprove hypotheses as your research progresses. Don’t let gaps in compared pedigrees lead to hasty conclusions.
When one door is blocked, look for another.
- Board for Certification of Genealogists (BCG), Genealogy Standards, 2nd ed. rev. (Nashville: Ancestry, 2021).
- Merriam-Webster’sCollegiateDictionary, 11th ed. (Springfield, Mass.: Merriam-Webster, 2011), 796.
- For definitions, see sidebar on page 20. For more information about advanced visualization and sorting techniques, see International Society of Genetic Genealogy (https://isogg.org/wiki/ Wiki_Welcome_Page).
- A FAN club, a term coined by Elizabeth Shown Mills, identifies associated people (Friends-Associates-Neighbors) of a research subject using documentary evidence. A biological FAN club is a group of genetically-related test takers who likely descend from the same distant ancestor of the research subject.
- BCG,GenealogyStandards, 2nd rev., 29–30.